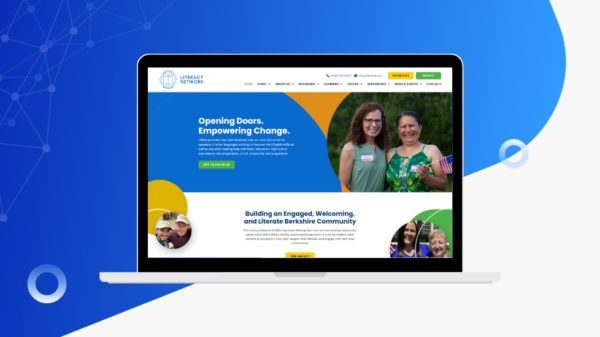
Literacy Network of South Berkshire (LitNet), a client of ours for several years, reached out about improving their annual impact reporting process. They wanted to move beyond traditional PDFs to better showcase their nonprofit’s work. Our team designed and built a new interactive website to present their annual report.
Through collaboration, we transformed LitNet’s impact report into a more accessible digital experience that better demonstrates their community impact.
Challenges
The main challenge was converting a print-oriented PDF impact report into pages on their website that would better showcase the nonprofit’s achievements and data. We needed to create interactive charts, improve accessibility, and enhance user engagement while preserving all the important information from their reporting.
By maintaining regular communication with the client’s team, we addressed the challenges that came up during this process, making sure their data and success stories would be more accessible and engaging online.
Our Approach
We started the project by focusing on two key things:
Regular Check-ins – From the very beginning, we made sure to meet and communicate regularly with LitNet’s team. This helped us fully understand what problems they wanted to solve and what goals they had in mind for their impact report. Their input directly shaped the pages we created.
Initial Research – We thoroughly examined their current impact report format and website integration possibilities. This gave us crucial information about what needed to be improved and helped us map out a plan tailored to their specific needs.
By collaborating closely and doing our research, we could focus on fixing LitNet’s main challenges with their annual reporting. As questions came up during the project, we maintained constant communication. Working closely with the client allowed us to create a website that effectively met their specific needs.
Execution
To transform their PDF reports into website pages, we took the following approach:
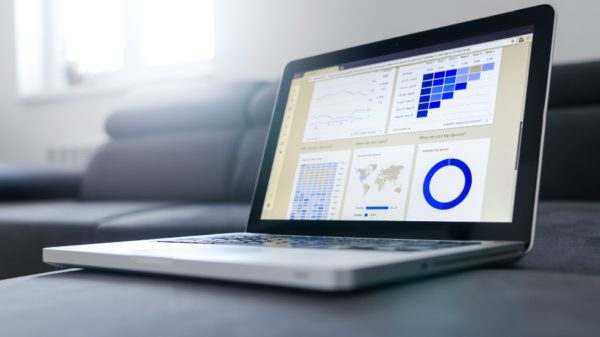
Building Interactive Data Visualizations
We replaced static charts from the PDF with dynamic visualizations that make their data more engaging. Our developers created responsive charts for tutoring program data, student demographics, and program outcomes.
These visualizations allow visitors to interact with the data by hovering over chart elements to see specific values and viewing tooltips with additional context. For example, hovering over a bar in the chart reveals the exact number of students in each program category.
Design & User Experience
One of our first steps was creating detailed mockups of all the new pages. Our design team developed visual designs that showed exactly how everything would be laid out, while carefully matching the nonprofit’s existing brand colors, typography, and overall website style. This ensured the report pages would feel like a natural extension of their main website. We reviewed these mockups with the client and made adjustments based on their feedback before beginning development.
A key goal was optimizing the new impact report for better engagement and accessibility, especially on mobile devices. The previous PDF format was difficult to read on phones and tablets. Our redesigned approach creates a consistent experience across all devices that presents LitNet’s achievements clearly.
Throughout development, we focused on responsive design to ensure the report worked well on all screen sizes. The result is an impact report that’s easier to access and share online.

Content Strategy & Organization
When converting a detailed PDF annual report to a website, we needed to maintain a clear narrative while making it easier to navigate. The client provided us with their content and requirements for what needed to be included in the report.
Working with their provided materials, we organized the information into logical, user-friendly sections. We created dedicated pages for key areas including tutoring programs, annual highlights, scholarship information, donor recognition, tutor spotlights, and community involvement opportunities.
Through thoughtful page layouts and design choices, we ensured their content was presented in an engaging way that enhanced rather than merely replicated their impact reporting.
SEO & Discoverability Improvements
With the impact report now integrated directly into their website, the content naturally became discoverable through search engines – an added benefit over the previous PDF format.
The report pages were connected to other relevant sections of their website, creating a cohesive user experience. This improves not only the report’s visibility but helps with the organization’s overall online presence.
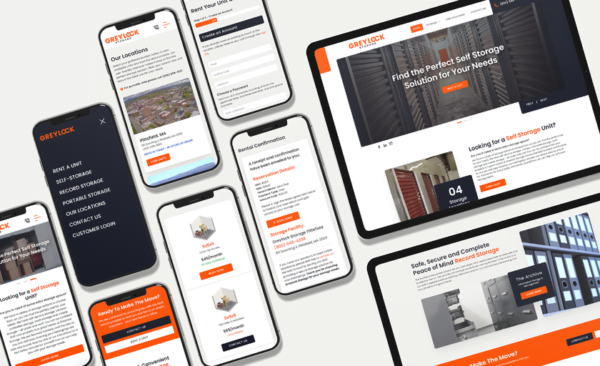
Mobile Optimization
Making the report accessible on mobile devices was an important part of the project, as the previous PDF format was difficult to read on phones and tablets.
We designed the pages to adapt smoothly to different screen sizes, ensuring the content remains readable and well-organized whether viewed on a desktop, tablet, or smartphone. The charts and data visualizations also resize appropriately for smaller screens.
This mobile-friendly approach makes it much easier for users to access the report from any device, greatly improving the reach and usability compared to the PDF version.

Easy Annual Updates
We built the report pages with future updates in mind. The structure allows our team to efficiently update the content each year without needing to rebuild everything from scratch.
We created reusable components and page templates that make it straightforward to update the data and content while maintaining the same design. This means when it’s time for next year’s report, we can focus on updating the information rather than redesigning the entire presentation.
This approach saves time and resources for both our team and the client in the long run, while ensuring consistency in how their annual reports are presented year after year.
The Results
Since launch, the new interactive impact report has shown good results. We’ve seen increased engagement with the report content and better mobile usage compared to the previous PDF format.
Our client is pleased with the final product and the smooth transition from PDFs to web pages. The new format makes their annual reporting more accessible and engaging for their audience.
Future Benefits
The new web-based approach gives the organization a more flexible foundation for future reports. The site works well on all devices, improves accessibility, and makes it easier to update content year after year.
Our work addressed the limitations of PDFs, particularly for mobile users, while adding interactive features that better showcase the nonprofit’s impact in the community.
Conclusion
This project shows how we helped Literacy Network move from traditional PDF reports to a more accessible and engaging website format. Their impact report is now easier to navigate, works well on all devices, and better showcases their important work in the community.
Is your website helping you share your story effectively? Let’s discuss how we can enhance your online presence.